Claude Code can do serious work, but as sessions grow, visibility drops fast.
You start with a simple goal, then end up asking questions like:
- Why did this session spike in cost?
- Which tool calls are bottlenecking?
- Which subagent produced this chain of actions?
- Why do I only see the problem after the run is over?
I hit this repeatedly while building with multi-agent flows, and raw transcripts were not enough for live debugging. That pain is exactly why I built and open-sourced ObservAgent.
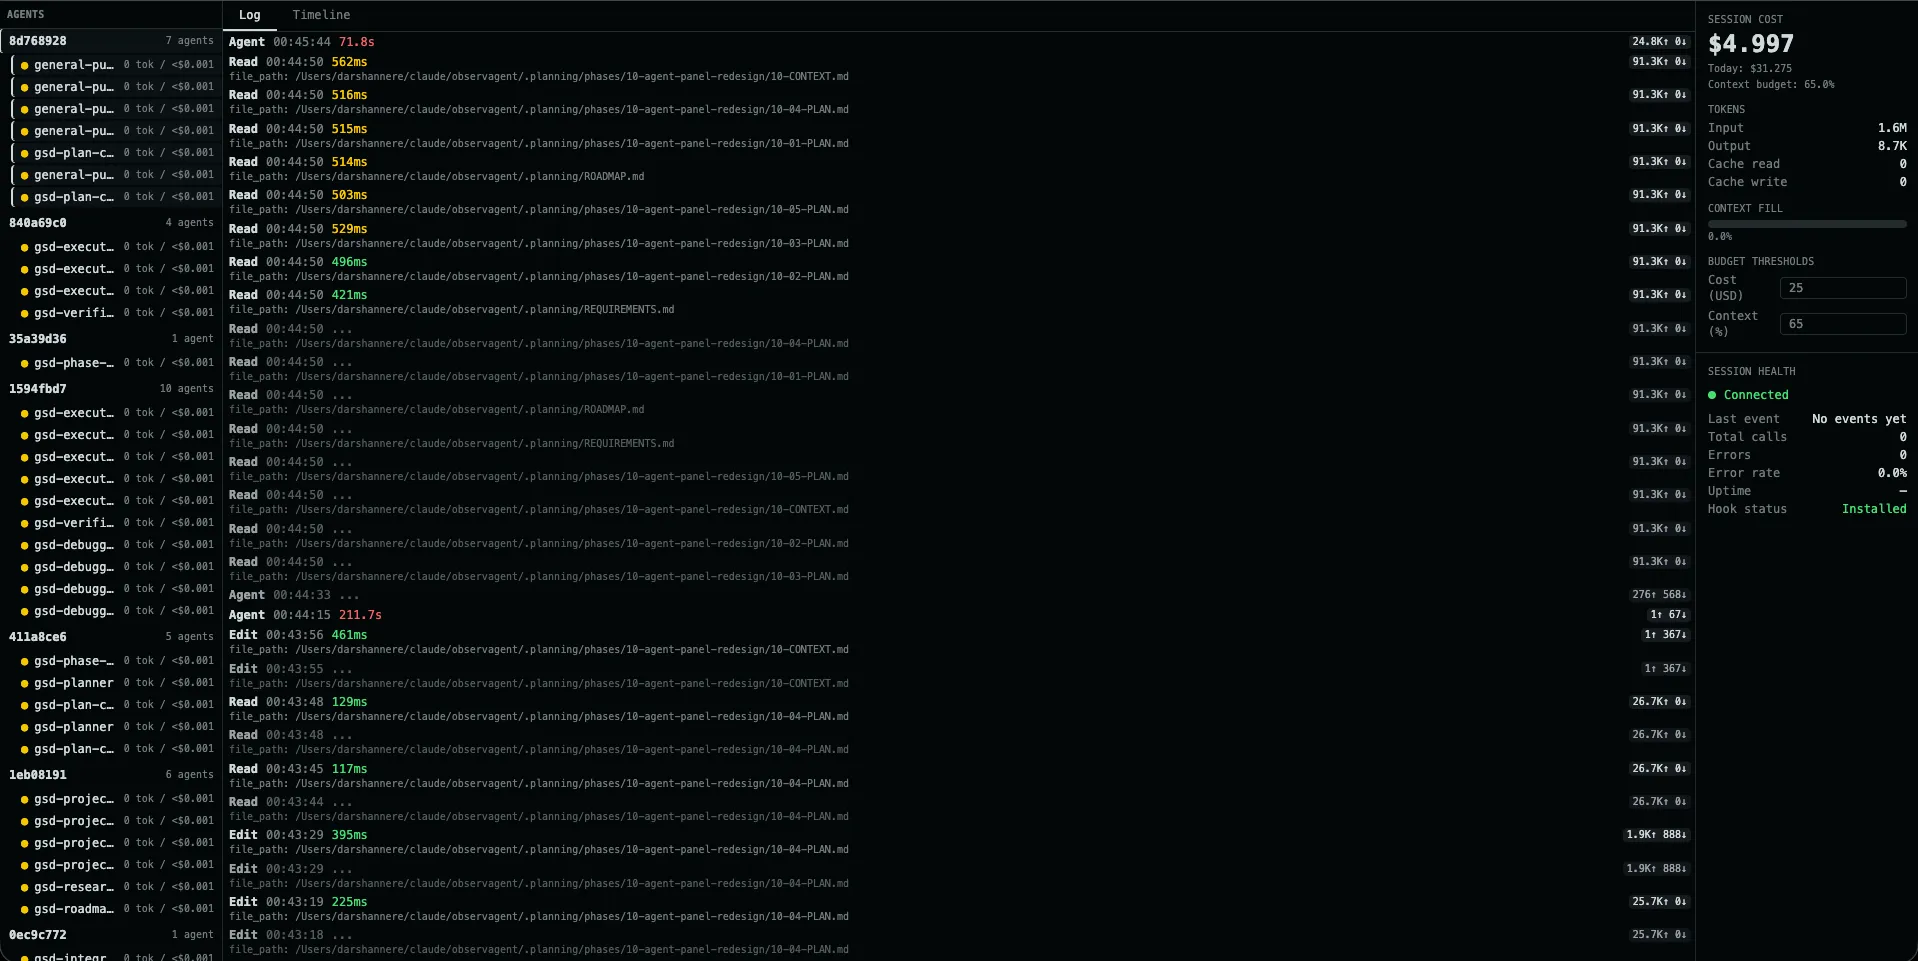
Live ObservAgent dashboard showing multi-agent activity, real-time logs, and in-session cost tracking.
The Gap I Wanted to Close
Claude already writes JSONL transcripts, but a transcript is a historical artifact, not a live observability interface. It’s hard to quickly scan, filter, compare, and reason about while the run is still happening.
I wanted something that felt closer to a production monitoring loop:
- see events as they happen
- watch cost in real time
- isolate one session or one subagent quickly
- review historical runs by repo
- export logs when I need deeper analysis
So the project direction became clear: local-first observability for Claude Code, with zero changes to user code.
What ObservAgent Provides
1) Live tool/event stream
ObservAgent streams events to the dashboard over SSE, so the log updates continuously without refresh-based workflows.
That means debugging can happen during execution, not only after it ends.
2) Session and subagent filtering
This was a major requirement for me.
Clicking a session filters that session. Clicking a subagent filters just that subagent’s calls.
That separation matters in real projects where multiple agents overlap and a single flat log becomes noisy very quickly.
3) Cost visibility while running
ObservAgent tracks usage and cost from Claude data and surfaces totals in-session, including budget context.
Instead of discovering spend after completion, you can react as the run evolves.
4) History panel by repository
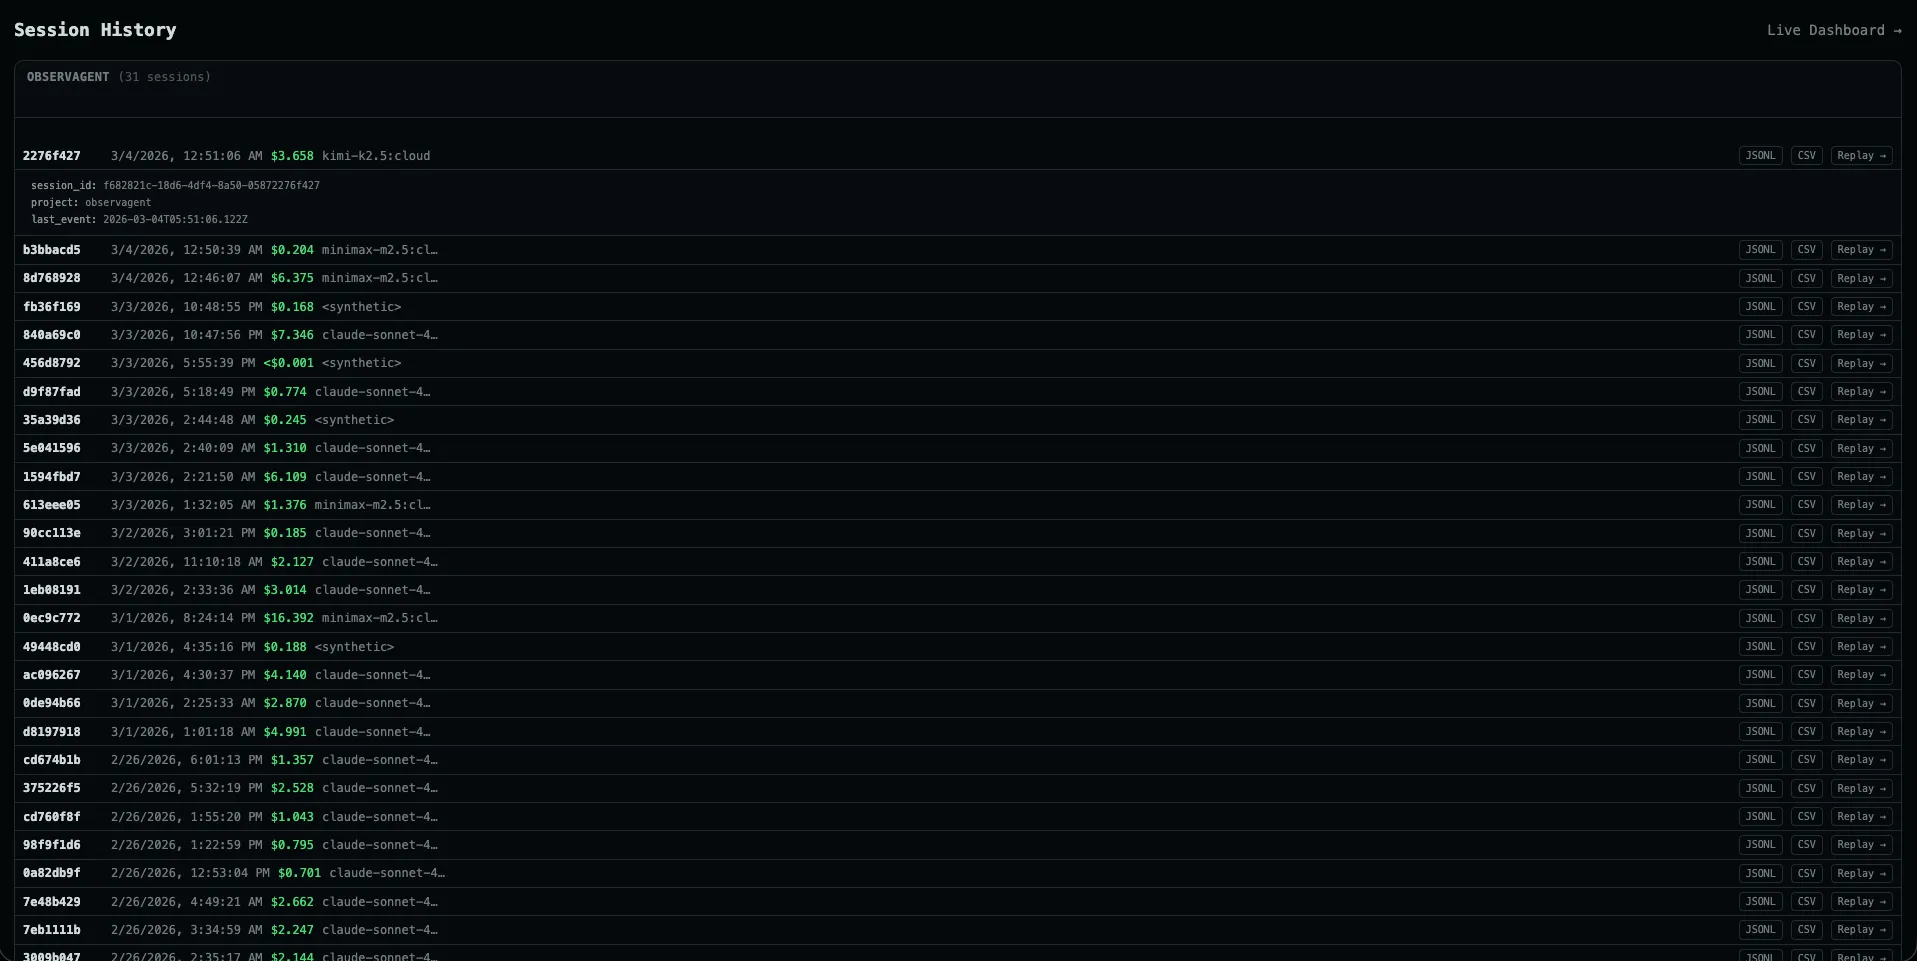
Repository-level session history with cost breakdowns, replay, and export for deeper analysis.
The History view groups sessions by repo/project and helps answer practical questions:
- Which repo is consuming most sessions?
- Which sessions were expensive?
- Which ones errored?
- Which run should I replay and inspect now?
It also supports one-click export in JSONL and CSV for external analysis.
Implementation Notes
The architecture is intentionally simple and dependable:
- Claude hooks emit event payloads.
- A relay script forwards those payloads to the local ObservAgent server.
- The server persists data in SQLite.
- SSE pushes updates to the React UI.
This keeps the system lightweight, inspectable, and easy to run locally.
No cloud dependency is required for core usage.
Design Principles Behind the Project
Local-first and private by default
The server is built for localhost usage and does not depend on telemetry pipelines.
For many users, this is table-stakes when dealing with sensitive coding workflows.
Minimal setup burden
You should not need to wrap your app, change your architecture, or rewrite prompts.
The goal is observability as a layer, not observability as a migration project.
Fast feedback loop
If logs and cost are not live, observability loses most of its value.
Live updates, filtering, and history replay are what make the dashboard actionable.
What I Learned Building It
“Good enough” logs are usually not good enough
Raw event dumps are fine for archival, but not for operational debugging.
You need structure, filtering, and timeline awareness to move quickly.
Filtering semantics matter
“Session filter” and “subagent filter” are different mental models.
Keeping both made the UI much more intuitive for multi-agent sessions.
History is not optional
Live views are great in the moment, but teams also need repo-level historical context:
cost trends, run counts, and exports for reporting.
Why I Open-Sourced It
I built ObservAgent for my own workflow first, but the underlying problem is shared by anyone doing serious Claude Code work.
Open source gives people three things:
- immediate utility
- transparency into how data is handled
- a path to improve the tool for different workflows
If you’re already running Claude Code heavily, this should help you debug faster and make cost/performance tradeoffs with more confidence.
Getting Started
npm install -g observagent
observagent init
observagent start
Then open the dashboard and run a Claude session. You should see events, session/subagent activity, and cost updates as the run progresses.
What’s Next
Planned improvements I want to push further:
- deeper per-tool latency analytics
- better comparative views in history
- stronger budget and error alerting
- smoother onboarding and diagnostics
If you try ObservAgent, I’d love feedback on what helps most and what still slows you down.